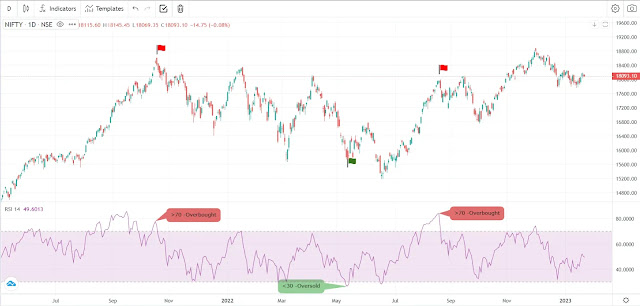
The Relative Strength Indicator (RSI) is a popular technical analysis tool that is used to measure the strength of an asset's price action. It compares the magnitude of recent gains to recent losses in an attempt to determine overbought and oversold conditions of an asset.
What is RSI?
- RSI is one of the leading technical indicator developed by J.Welles Wilder Jr. RSI helps us to understand the change in trend by identifying whether a stock is overbought or oversold. It measures the speed and change of price movements and compares the average gain and the average loss over a certain period. So for example, if your RSI is set to 14, it compares the bullish candles and the bearish candles over the past 14 candles. When the RSI value is low, it means that there were more and stronger bearish candles than bullish candles over the past 14 candles; and when the RSI is high it means that there were more and larger bullish candles over the past 14 candles.
The RSI is calculated using the following formula:RSI = 100 - (100 / (1 + (Average Gain / Average Loss)))Where "Average Gain" is the average gain of the asset over a certain period, and "Average Loss" is the average loss of the asset over that same period.
- RSI is called as Momentum Oscillator because it oscillates between 0 and 100. In common, a price with RSI reading over 70 is identified as overbought and an RSI reading of below 30 is considered as oversold. These are widely accepted indicative numbers and it does not mean that you enter new position or exit your position once RSI reaches either 30 or 70. It just indicates that the price is going to reverse sooner or later hence you need to be alert whether to take fresh position or exit your holdings.
RSI Divergence:
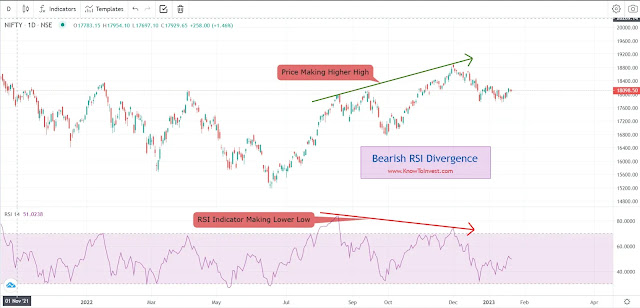
- A Divergence is a basically a disagreement between price and an indicator. Which means that, price will continue to make a higher high but the RSI indicator you are using makes a lower high. This is a clear signal that the uptrend is going to reverse sooner. So you need to make decision either to book profit or keep a strict SL.
- Divergence works better when the price is in clear uptrend or downtrend. Avoid looking for divergence during sideways market where price is moving within a range. Divergence that occurs in uptrend is called Bearish divergence and divergence occurs in downtrend is called Bullish divergence. During Bullish divergence, price makes a lower low and the indicator makes higher low. In bearish divergence, price makes a higher high and the indicator makes lower high.
- It's important to note that an RSI divergence is not a signal to buy or sell, but rather a signal that the current trend may be losing momentum and a potential trend reversal is imminent. Therefore, it's always recommended to use RSI divergence in conjunction with other technical analysis tools and fundamental analysis to confirm the signal and make a more informed decision.
Bullish Divergence Example:
Bearish Divergence Example:
Conclusion
In conclusion, the Relative Strength Indicator (RSI) is a popular technical analysis tool that is used to measure the strength of an asset's price action. RSI divergence occurs when the direction of the RSI indicator and the direction of the price of an asset are moving in opposite directions. This divergence can be a strong indication of a trend reversal. For example, if the RSI is making new highs while the price of the asset is making new lows, it is a bearish divergence, indicating a potential trend reversal to the downside. RSI divergence is not a signal to buy or sell but rather a signal that the current trend may be losing momentum and a potential trend reversal is imminent. Therefore, it's always recommended to use RSI divergence in conjunction with other technical analysis tools and fundamental analysis to confirm the signal and make a more informed decision.


